Танго как соревнование: научный подход для “чайников”

phineasandferb13_7088

Вступление

Танго – “социальный” танец с длинной историей профессиональной деятельности на “периферии”.  От “живой” музыки до “ДиДжеев”, от преподавания танцев до “просто потанцевать” – кругом есть практика и история платных услуг.  Как и у других “социальных” танцев, у танго также есть и история соревнований, особенно во время “Золотого Века”.  Например, Петролео, прославленный тангеро и “танцор внаем”, начал свою карьеру соревнуясь на чемпионатах милонг.  Сегодня, как и тогда, многие дороги в профессиональное танго начинаются на соревнованиях.  Справедливо утверждать, что понятие соревнования не чуждо миру танго.

В наши дни вершиной соревнований танго является Чемпионат Мира По Танго (Campeonato Mundial de Baile de Tango), истоки которого в 2003 году.  Этот чемпионат помог многим сегодняшним профессиональным танцорам начать карьеры и, таким образом, внес лепту в популяризацию Аргентинского танго вокруг мира.  Чемпионат открыт всем – можно записаться в квалификационный раунд и оттуда продвигаться вверх.  В отличие от бальных соревнований, в чемпионате танго нет жесткой обязательной программы, так что, теоретически, нет необходимости “зубрить” программу, стремясь удовлетворить жюри.  Можно “лишь” учиться танцевать – постичь музыкальность, движение, связь в паре – словом, стать хорошим “социальным” танцором – и надеяться прилично выступить в категории “салон” Мундиала.  Такова, по крайней мере, теория.  В то же время, отсутствие обязательных элементов, вокруг которых нужно строить занятия, привносит риск: члены жюри, не имея общей, идентичной платформы, могут судить по разному, и выводам жюри может не хватать объективности.  А можем ли мы судить об объективности жюри?  Могут ли судьи возвыситься над своими предвзятостями и корнями?  Как, вообще, велика разница между победителями и вторым местом?  Другими словами, что, вообще, может нам сказать о танго соревнование?  В этом эссе мы, вооружившись каплей статистики, глянем на Чемпионат Мира 2016 (салон), данные для которого, как теперь принято, общедоступны (напр., финал).

Забегая вперед, скажу, что мы найдем на удивление полные ответы на все эти и другие вопросы, например:

  • Можно отличить плохих танцоров от хороших, и хороших от отличных
  • Чем лучше танцоры, тем труднее различить их уровень со стороны пользуясь ныне существующей системой оценок.  В финале порядок мест практически случаен.
  • Судьи привносят в оценки свои предвзятости, которые могут сильно отражаться на оценках, как случайным образом, так и систематично.   Например, судьи много выше оценивают якобы более сильных танцоров, даже если это одни и те же танцоры!
  • Судьи часто и сильно разнятся во мнениях, и могут постоянно друг другу противоречить!

Я надеюсь, что моя попытка привнести данные в журналистику танго окажется многим познавательной и интересной.  Я старался сделать материал доступным к пониманию людям, не подкованным в статистике, и при этом вызывающим доверие специалистов.  Весь код прилагается.

Итак, вперед!

Чемпионат мира: участники

Чтобы поразмяться, начнем со стран, представленных в Чемпионате.  Не считая прямых квалификаций в полуфинал и финал, участники представляли 27 стран.  Во многих случаях, эти страны были представлены лишь горсткой участников, но некоторые страны прислали большие и порой очень сильные делегации.  Такая широкая репрезентация вне Аргентины позволяет нам задать наш первый вопрос: а есть ли страны, в которых культура танго особенно сильна?  Например, часто доводится слышать о сильном профессиональном танго в Колумбии и России.  Итак, График 1 – распределение мест по странам.  Действительно, Россия и Колумбия, со средними местами ~60 и~80 из 400 пар, соответственно, выделяются среди других стран!  Более того, эти результаты достигают статистической значимости – крайне маловероятно, что это случайное отклонение от среднего!  (Здесь и далее, мы опускаем детали.  Зануды вроде автора могут пройтись по коду сами.) Итак, похоже, есть две страны с необычно сильными профессионалами (ф основном профессионалы, все-таки, тренируются, покупают билет, и едут соревноваться в БА).

fig1

Figure 1  Results by country in the qualifiers and semifinals.  Note strong qualifying round performance from Russia and Columbia.

А как же Аргентина? – спросит скептик.  График 1 подразумевает, что именно Аргентина вполне посредственна!  Но всем известно, что Аргентинцы очень хорошо выступают в Чемпинатах Мира, и обычно выигрывают.  В чем же дело?  В том, что Аргентина, как организатор и хозяин первенства, приводит самую большую а, главное, и местную, делегацию – 289 пар в квалификационном раунде (из 404).  То есть, Аргентина средняя потому, что она в большинстве, и она дома.  Более дальние и сравнительно не самые богатые страны, вроде Колумбии и России, не могут прислать всего лишь “неплохих” танцоров – таким танцорам накладно ехать в БА без шансов на успех.  Поэтому из более бедных или более дальних стран в Аргентину попадают в основном профи.  Этот феномен, как мне видится, и отвечает за относительный успех этих стран.

Полуфиналисты отсеиваются в квалификационном раунде, попадают с чемпионатов своих стран, или занимают высокие места в Campeonato de baile de ciudad (городском чемпионате БА).  В полуфинале, учитывая много более высокий уровень танцев после отсева, Россия более не выделяется, а Колумбия выделяется лишь едва-едва.  Огромное количество аргентинцев сказывается – в полуфинале 71 пар из 108 – из Аргентины.

Чемпионат Мира: человеку свойственно ошибаться

Часть I: Танцоры

Мы начнем расследование темы грешности человека с Графика 2.

fig2

График 2.  Результаты квалификационного дня 2 против дня 1 для одних и тех же пар.  Пары, прошедшие в полуфинал, показаны красным.  Черная линия показывает идеальное и ожидаемое равенство, где все пары выступают одинаково хорошо оба дня, а синяя линия показывает настоящее взаимоотношение между результатами двух дней.  67% величины результатов дня 2 объяснимы днем 1.  Красная вертикальная линия показывает разброс результатов средней пары меж дней (95% разброса).  То есть, все, кого в пределах погрешности наблюдений, можно было назвать потенциально лучшими, прошли в полуфинал (это хорошо). С другой стороны, все пары, прошедшие в полуфинал, примерно равны в глазах судей если смотреть на результаты двух дней (это плохо).

Каждая точка графика соответствует одной паре.  На оси иксов результаты первого дня, а на оси игриков – второго.  Красные точки соответствуют парам, прошедшим в полуфинал через квалификационный раунд.  Черная линия показывает идеальную ситуацию: судьи присуждают парам одинаковые результаты в каждый из дней.  Синяя линия показывает настояшее взаимоотношение между результатами, присужденными каждой паре в каждый из дней.  Красная вертикальная линия показывает разброс результатов средней пары за два дня.  То есть, в 95% процентах случаев, жюри даст каждой паре оценку, колеблющуюся в пределах одного полного очка.  Красная линия центрирована на средней по результатам паре из прошедших в следующий раунд.   Обратите внимание, что разброс оценок, центрированный на средней квалифицировавшейся паре, примерно равен разбросу результатов всех пар, прошедших в полуфинал.  Что это означает?  Оптимистично, можно утверждать, что процесс сработал, и пары, прошедшие в полуфинал, прошли бы опять, если бы соревнования повторились.  На этом хорошие новости более или менее заканчиваются, и на более пессимистичной ноте можно сказать, что пары, прошедшие в полуфинал, были примерно равны в глазах судей – что судьи, похоже, не смогли бы повторно оценить выступления в том же порядке.  В другие дни пары продолжали бы быть довольно близки друг к другу по сравнению с разбросом оценок каждой пары, с колебаниями в местах из-за небольшой разницы в уровне каждой пары ото дня в день и из-за флуктуации оценок и состава жюри.  Если это смелое утверждение справедливо, то средние результаты пар, прошедших в полуфинал, мало что могут сказать нам о местах в самом полуфинале: мы ожидаем сильные помехи среди этих заведомо сильных пар ввиду случайных флуктуаций.  Ранги выступающих, стало быть, должны, в таком случае, быть нестабильны.  Вот это-то, как раз, легко проверить!  Насколько существенно взаимоотношение между результатами пар, прошедших в полуфинал, между полуфиналом и квалификационным раундом?

fig3

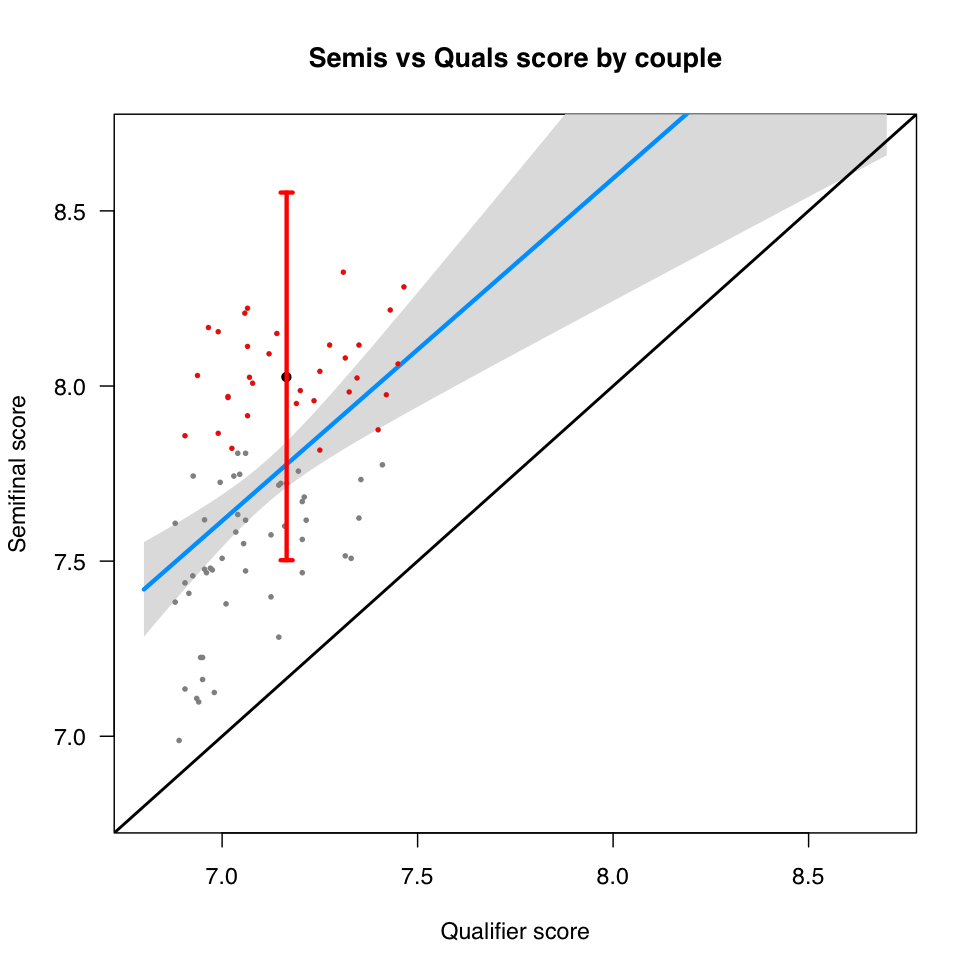
График 3 Результаты полуфинала для пар, прошедших из квалификационного раунда.  Пары, прошедшие в финал, выделены красным, а красная вертикальная линия показывает разброс в оценке средних финалистов, и центрована как раз на средней паре.

График 3 однозначно доказывает: здесь все неоднозначно.  Зависимость есть, но она невелика.  Результаты квалификационного раунда объясняют всего 24% оценок в полуфинале!  Другими словами, если пары, прошедшие в полуфинал из предыдушего раунда, раньше явно выделялись из большинства,  то теперь, как и в прошлом раунде, пары, прошедшие в следующий раунд (финал), примерно равны и, что хуже, не очень отличаются, в пределах разброса, от пар, в финал не прошедших.  Две трети пар могут претендовать на примерное равенство в пределах разброса!  Обратите внимание, что не все полуфиналисты представлены в этом графике: мы исключаем те пары, которые попали в полуфинал из других турниров. Итак, скудные хорошие новости из этого раунда: другое жюри, оценивающее те же пары, оценило их в порядке, отдаленно напоминающем предыдущий.  Плохие новости: порядок в основном другой.  Что хуже, этот график выглядит немного странно, особенно по сравнению с предыдущим: все результаты в полуфинале, для всех пар, выше, чем в квалификационном раунде – все точки выше черной линии.  С этим мы разберемся чуть позже, а пока возьмите этот факт себе на заметку.

Дабы закончить наше расследование стабильности оценок, глянем на график 4, показывающий пары, прошедшие из полуфинала в финал.

fig4

График 4.  Результаты финала и полуфинала для одних и тех же пар.  И снова результаты выше, чем в предыдушем раунде!

Теперь результаты совершенно иные.  С точки зрения статистической значимости, соотношение между оценками пар в финале и полуфинале “наводит на мысль” о каком-то взаимоотношении, но не более того.  Глядя на график, можно предположить, что и вовсе нету никакого соотношения.  Но пары-то, заметим, одни и те же!!!  Статистика, впрочем, говорит, что, возможно оно и есть, но небольшого количества финалистов с предысторией в полуфинале недостаточно для уверенности.  И опять все пары сильнее, чем раньше.  Постараемся это запомнить, а пока резюмируем выводы из графиков 2-4.

  1. В квалификационном раунде, где пары соревновались дважды, разброс оценок был примерно 1.5 очка.  В более поздних раундах, игнорируя систематическое улучшение оценок, разброс по сравнению с предыдушими раундами был примерно таким же как и между двумя днями квалификационного раунда
  2. Победители квалификационного раунда все как раз и поместилисъ в разброс 1.5 очка от средней пары, прошедшей в полуфинал
  3. В каждом последующем раунде, результаты прошедших пар все менее похожи на предыдущие раунды
  4. В каждом раунде, результаты всех прошедших пар неуклонно растут

Объяснение, которое наиболее правдоподобно и которое обобщает первые три наблюдения, таково: совокупность правил оценки и формата соревнований, а также и разница в составе жюри, не дают возможности оценить выступление точнее, чем +/- 0.7 очка.  Могут ли сами танцоры быть настолько непостоянны?  Маловероятно.  В первую очередь мы можем так полагать потому, что с каждым раундом турнир должен отбирать все более сильные и, вероятно, постоянные пары.  В первом раунде это очевидно происходит.  Однако разброс оценки с каждым раундом почти не падает!  Если бы разброс оценок зависел в основном от танцоров, то он бы падал с каждым раундом, а не оставался бы тем же или рос.  Итак, мы подозреваем судейскую систему.

Часть II: Судьи

На данный момент мы установили, что судьям свойственно совершать небольшие, но заметные и случайные, ошибки в оценках – ошибки, которые с каждым раундом, похоже, все более влияют на порядок мест, от “немного” в квалификационном раунде до “решающе” в финале.  К сожалению, такие случайные ошибки не являются единственными ошибками в судействе.  Вероятно, наиболее серъезно отсутсвие объективности в оценочном процессе.  Я не утверждаю определенно, что судьи предпочитают пары по внешнему виду, возрасту, или другому параметру – я не могу этого доказать на основе имеющихся данных.  Однако, я определенно утверждаю, что предрассудки судей играют большую роль.  Вернемся к наблюдению 4 выше.  С каждым раундом, результаты каждой пары, не вышедшей из игры, растут.  Этот факт иллюстрирован в Графике 5.

fig5

График 5.  Этот график показывает результаты всех пар, прошедших в финал, которые начали соревнования в квалификационном раунде.  Ось игриков показывает разницу в оценке каждой пары по сравнению с их оценкой в квалификационном раунде.  В самом квалификационном раунде наблюдается знакомый нам разброс результатов по сравнению со средней парой.

Итак, все пары неуклонно и заметно улучшаются с каждым раундом.  Невозможно предположить правдоподобность такого феномена!  Более вероятно, что судьи считают пары в более высоких раундах более сильными, чем пары в более ранних раундах, даже если это одни и те же пары!!!   Такая склонность подтверждать свое мнение в статистике называется confirmation bias. Склонность отражать раунд в оценке навряд ли сильно отражается на порядке мест.  Однако, какие еще предвзятости таятся в оценках?

Установив предвзятость в одной из форм, взглянем на некоторые другие аспекты оценок жюри.  Оказывается, можно примерно оценить, на что смотрят судьи, группируя результаты по некоторым “направлениям” оценок жюри.  Для этого, привлечем подход под названием “метод главных компонент”.  Мы не будем вдаваться в детали, но лишь заметим, что главные “компоненты”, вероятно, описывают самые важные аспекты оценок.  По крайней мере, они группируют танцоров по отношению к главным аспектам консенсуса судей.  Графики 6-8 показывают главные направления вариации в полуфинале и финале (полуфинал представлен дважды: все танцоры, и только те, кто прошел в финал).  Стрелки представляют мнения индивидуальных судей  и порядок мест танцоров (сортированный по консенсусу мнений).  Стрелки обозначены именами судей.

fig6

График 6.  Результаты полуфинала.  Большинство судей соглашаются о результатач, и хушая треть, середина, и лучшая треть танцоров в обшем отделимы в первой “компоненте” оценок.  Эта компонента объясняет 39% оценок, что немного, но и немало.

fig7

График 7.  Результаты полуфинала лишь среди пар, прошедших в финал . Согласие судей намного менее заметно – оно объясняет 21.5% оценок.  Двое судей полностью несогласны в главных двуx “компонентах”!

fig8

График 8  Судьи продолжают не вполне соглашаться в оценках.  Главная компонента объясняет 35.5% разброса оценок.  Мнения судей все еще склонны диаметрально расходиться.

Главный смысл этич графиков таков: рассматривая только главное направление вариации, вероятно, описывающее технику или музыкальность танцоров, консенсус жюри не очень единогласен.  При этом, больше всего разногласий в финале.

Метод главных компонент немного абстрактен, так что приведем более понятный пример.  Заметим, что Аврора Любиз и Габриел Миссе часто несогласны друг с другом по методу главных компонент.  Посмотрим же, в Графике 9, насколько расходятся оценки, данные ими танцующим парам.

fig9

График 9.  Судьи порой расходятся во мнениях.  Оценки Габриеля Миссе слабо противоположны оценкам Авроры Любиз.  Стоит заметить, что его оценки также намного ближе друг к другу, нежели оценки Авроры.  Габриел, фактически, считает, что финалисты малоразличимы в уровне танго – мнение, поддерживаемое нашими моделями.  Аврора же силъно разделяет танцоров по уровню, с ясными победителями и проигравшими.

Может ли быть, что невозможно сравнивать танцоров выше определенного уровня?  Для сравнения, посмотрим на наших кузенов, танцоров бального танго, участников соревнования Блэкпул, одного из самых престижных бальных соревнований в мире.

fig10

График 10. Постоянство оценок в Блэкпул.  Количество голосов судей, рекоммендующих пару в следующий раунд, очень коррелируется между первым раундом и полуфиналом (глядя на одну и ту же пару).  Несмотря на много меньшее число участников, статистическая значимость этого взаимоотношения сравнима с соотношением результатов квалификационного раунда и полуфинала (см. выше).  Следует полагать, что оценки выступлений в Блэкпул более аккуратны и единогласны среди судей.  

fig11

График 11.  Даже среди финалистов, оценки в Блэкпуле более повторимы между раундами, несмотря на меньшее количество участников, чем в чемпионате мира по Аргентинскому танго.

Графики 10 и 11 демонстрируют довольно высокую стабильность оценок пар между раундами, примерно как стабильность оценок между квалификационным раундом и полуфиналом Аргентинского танго выше.  Тогда мы называли тот уровень неважным, оставлявшим существенное равенство между парами, переходящими в следующий раунд.  Однако можно подметить, что соотношения в Блэкпуле нелинейны (формы бумеранга) и недооцениваются нашим подходом.  Проблема в том, что в Блэкпуле, похоже, не использовали оценки, а вместо этого “вызывали” танцоров в следующий раунд.  По крайней мере, именно такие данные мне удалось найти.  Следовательно, требуется другой способ оценки соотстветствия результатов раундов.  Не вдаваясь в детали, оценки много более стабильны, чем они выглядят и более напоминают способность оценить победителей квалификационного раунда в Чемпионате Мира.  Почему оценки в Блэкпуле более стабильны?  Возможно, что это, отчасти, результат присутствия обязательных элементов и, соотстветственно, более высокая стандартизация оценок качества танца.

Прощать божественно

Значит ли все вышеизложенное, что система соревнований безнадежно сломана, и оценивать танго среди профессионалов невозможно?  Вовсе нет.  Профессионалов вполне возможно оценить от любителей – фактически, именно это и происходит в квалификационном раунде.  Наверняка существуюшую систему можно улучшить.  Например, судьям можно устраивать “тренировочный раунд”, где они оценивали бы одни и те же пары на видео с тем, чтобы оценить разногласия жюри и прийти к консенсусу до начала соревнований.

Стоит ли оценивать танго, как бальные танцы, по системе обязательных элементов?  Наверное, нет.  Гармония и красота танго – в его импровизационных корнях.  Разнообразие для танго – кислород, и не стоит им поступаться ради улучшения системы оценок.  В конце концов, победители будут нас учить лишь тому, в чем сами сильны.  А пока признаем, что судьи – люди, что они стараются судить хорошо и, наверное, будут пытаться улучшить систему, если эта и подобная информация к ним попадет.

В дополнение ко всему сказанному выше, запомним, что профессиональные танцоры и преподаватели склонны к непроизвольной предвзятости и не могут оценить одних и тех же танцоров одинаково в разных раундах.  Следовательно, как танцоры, не будем это забывать, выбирая партнера или партнершу для танды, и стараться не учитывать исподволь возраст, красоту, или другие поверхностные факторы.  Не стоит также забывать, думая об оценках танцоров в Буэнос Айресе, что лучший танцор в комнате, пожалуй, не намного лучше второго лучшего, если их оценивать в соревновании.  Пусть эти данные будут зеркалом для каждого.

Я надеюсь, что вы нашли эту статью полезной и интересной.  До встреч на милонгах!

Boris

Код добавить не удалось из-за настроек безопасности.  Пишите если хотите посмотреть.


Tango as a competition: a scientific look for a non-scientist.

phineasandferb13_7088

Introduction

Tango is a social dance with a long history of professional “cottage industries” around it, from musical performance and DJing to dance teaching and taxi dancing.  Like other social dances, tango has had a history of competitions during its Golden Age.  For instance, Petroleo, the famed tanguero and taxi dancer, started his career competing in tango tournaments.  Today, as back then, some roads to professional tango start in competitions.  It is fair to say that the concept of tango championship is organic to the tango universe.

Today, the pinnacle of tango competition is the Tango World Championship (Campeonato Mundial de Baile de Tango), which goes back to 2003 and has helped launch careers of many established professionals.  The resulting “official label” has probably helped legitimize many of the traveling pros and therefore popularize modern Argentine tango outside of Argentina.  The championship is not limited to the pros – anyone can enter the qualification round and, hopefully, advance.  Unlike ballroom competitions, there’s no defined syllabus, so there’s no need to drill to a jury’s expectations.  By learning to be musical, move well, and connect to your partner – by being a great social dancer – one can hope to succeed in the salon category of The Mundial.  At the same time, not having a syllabus to judge against, and not having launched their careers around syllabi, members of a jury may be judging from different vantage points and coming to subjective conclusions about the dancing couples.  Is it possible to tell whether the judging is objective?  How well do the judges compensate for their biases?  And how big is the difference between winners and runners up?  In other words, how much does tango competition tell us about tango?  In this essay, we arm ourselves with fairly simple statistical tools and take a look at the 2016 competition data for tango de salon (available online – e.g., the finals).

Jumping ahead, I will say that we find surprisingly complete answers to all of the above questions.  Some teasers:

  • It is possible to tell apart bad dancers from good dancers, and great dancers from good dancers
  • The better the dancers, the less possible it is to rank them with the current scoring system, until, in the finals, rankings don’t really make sense
  • Judges bring many biases to the table. For instance, “confirmation bias” – they rank supposedly better dancers higher even if there is no difference
  • Judges often disagree – boy, do they ever!

I hope this exercise in data journalism proves educational and interesting, and I have gone to great lengths to ensure that it’s simple for the un-initiated and rigorous for the rest.  All of the code will be available with this write-up when all parts are posted.

Read on for more!

Campeonato Mundial: the participants

To warm up, let’s start with the countries in the Campeonato Mundial.  Excluding the direct qualifiers to the semifinals and finals, the participants hailed from 27 countries.  In many cases, these countries had very few representatives, but some parts of the world fielded very strong and often large teams.  This strong participation allows us to ask ourselves our first question: do some countries have especially strong tango cultures?  For example, there’s anecdotal evidence that professional tango is very strong in Colombia and Russia.  This brings us to Figure 1 – rank distribution by country.  Russia and Colombia do indeed look to have very strong representations – with median ranks of ~60 and ~80 in a crowded field of over 400 contestants.  Moreover, these results are statistically significant – they are highly unlikely to arise by random chance (here and elsewhere, the savvy readers are encouraged to step through the attached code – we will skip such details in most cases).  It would seem that, indeed, there are countries with exceptionally strong professional cultures.

fig1

Figure 1  Results by country in the qualifiers and semifinals.  Note strong qualifying round performance from Russia and Columbia.

What’s going on with Argentina?  Figure 1 suggests that Argentina is decidedly average!  But everyone knows that the Argentines usually do very well at the championships, usually winning.  What gives?  It turns out that Argentina, being the host, has by far the largest delegation – 289 contestants in the qualifiers out of the total of 404.  It is basically the baseline. Relatively distant and at the same time relatively mid-income countries like Columbia and Russia are unlikely to send many merely decent dancers, and the people who fly to Buenos Aires to show off their chops tend to be pros.  This, I suspect, is the reason for these countries’ delegations unusually strong performances.

To get to the semi-finals, couples are pruned by high scores in the quals, placed directly from nationals elsewhere, or place highly in Campeonato de baile de ciudad.  Given the much stronger field, all of the stand-out effect of Russia is gone, and Columbia is barely noteworthy – leading the field with a marginally unusual placement rate. The sheer number of the great Argentine dancers tell – Argentina leads the semi-finals field with 71 dancers of the 108 competitors.

Campeonato Mundial: to err is human

Part I: The Dancers

To introduce the topic of human fallibility, look at Figure 2.

fig2

Figure 2  Day 2 scores vs Day 1 scores.  Couples that qualified for semifinals are shown as red points.  The black line shows ideal equality (all couples score the same on both days), while the blue line shows the actual relationship between scores on two days.   The day 2 scores are 67% explained by the day 1 scores.  The red bar points out inter-day, intra-qualifier uncertainty in score for semifinal qualifiers (95% confidence interval).  Essentially, everyone who might have been the best in the quals qualified for the semifinals (a good outcome).  Another way to say it is, in the eyes of the judges, all couples that advanced to the semis are essentially tied (a bad outcome).

Each point on the figure corresponds to a couple.  On the x axis are the day 1 scores, while on the y axis are the day 2 scores.  Red points are the couples that qualified for the semifinals from the quals.  The black line shows the ideal situation – that human judges give couples exactly the same scores each time they see them dance three songs.  The blue line illustrates the actual correspondence between the scores.  The red bar shows the uncertainty in the score on day 2 based on this model given a couple’s score on day 1.  In other words, in 95% of the cases, a jury would give the score in that range.  The score is shown for a “median” qualifying couple – half of the qualifying couples did better and half worse.  This score roughly spans more or less the range of all qualifying couples.  What does this mean?  The complimentary way of saying this is: the process worked, and the couples that made it into the semis from the quals would have made the cut in most cases.  The less complimentary way of saying this is: the couples qualifying for the semis were essentially jointly tied for the first place in the quals.  If this pattern held, we would expect these couples to continue to be tied.  In other words, looking at their ranks in the qualifiers would give us very little information about their ranks in the semifinals.  If they are all tied, then each time they compete their scores would fluctuate slightly due to couples’ day-to-day variability and judges’ slight differences in perception, as well as due to a jury’s composition.  There would be no stability to the ranks.  This is something we can easily check. Do couples perform in the semifinals according to their ranks in the quals?

fig3

Figure 3 Semifinal scores of the couples that qualified to the semis from the quals.  The couples that qualified for the finals are shown in red, and the red bar illustrates the uncertainty in the score of median finals qualifiers based on score stability.

Figure 3 unambiguously tells us: sort of.  In fact, qualifiers scores for couples who made it to the semifinals explain only 24% of their scores in the semis.  In other words, whereas qualifiers contestants were mostly well separated from the couples who made it to the next round, the semifinalists were mostly tied in the sense of being within the red bars of score uncertainty (95%). The error bar is placed over the median couple that qualified from the semis to the finals.  Roughly two thirds of all couples can be thought of tied with the winners.  Notice that we are excluding a number of couples from this plot – everyone who qualified directly into the semis from a national competition or the Ciudad.  Here’s the meager good news from this round: a new jury looking at the same couples ordered them in an order somewhat resembling their standings from the quals.  The bad news is: the order is mostly different.  Worse, this plot looks weird, especially if you compare it to Figure 2: all of the scores in the semis are higher than they were in the quals – all points are above the black line.  All couples that made it into the semis from the quals scored better.  We will look into this separately, so for now make a mental note that there’s something going on here.

To round off our investigation of score consistency, let’s look at Figure 4, showing the couples that qualified from the semis into the finals.

fig4

Figure 4.  Finals vs semifinals scores for the couples that qualified for the finals.  Notice that, once again, finals scores are higher for every couple.

Now there’s very little consistency to the scores.  Statistically, the relationship among couples’ scores in each round is “suggestive”: maybe it’s there, maybe it’s not.  It’s not unreasonable to believe, based on this plot, that there may be no relationship.  Most likely, there is, and there are just too few dancers to tell.  Once again, the figure looks weird – all couples seem to be doing better – but we’ll come back to this.  Instead, let’s tally up what we see in figures 2-4.

  1. In the qualification round, where couples competed over two days, score uncertainty per couple was about 1.5 points. In later rounds, that was also roughly the relationship between scores of round winners in a round and their scores in the next round
  2. Winners of the qualifiers fell almost exactly 1.5 points from the highest-scoring couple
  3. With each round, the scores of couples advancing to the next round bear less and less similarity to the same couples’ scores in that next round
  4. With every round, the relationship between the scores of advancing dancers in both rounds seems to look weirder and weirder.

The explanation that makes the most sense, that neatly wraps up the first three observations is this: given the scoring rules and the competition format, the judges are unable to determine scores more accurately than to within +/- 0.7 points.  Is it possible that the dancers’ performance fluctuates by that much?  Probably not.  The main reason to believe that it’s not the dancers is simply this: every round is supposed to select better, more consistent couples (and the first round certainly does!).  Why don’t these couples’ score variabilities between rounds shrink?  If dancers’ consistency drove the score variability, with every round the uncertainty in scores of advancing dancers would decrease rather than stay the same or grow.

Part II: The Judges

We have established the judges made seemingly random (though relatively small) errors in judgement – errors that increasingly seemed to affect final standings in every successive round, from “not much” in the quals to “almost entirely” in the finals. Unfortunately, these random mistakes are not the only errors in judging.  Probably of greatest concern is lack of objectivity in scoring.  I am definitely not suggesting that judges favor by looks, age, or any other parameter – I don’t have any evidence for this.  I am, however, unequivocally stating that the judges bring their perceptions to the table – strongly so.  Consider the observation number 4 above.  In every plot, 2-4, the scores of every couple in a successive round are higher than they were in the preceding one.  This is illustrated most clearly in Figure 5: in every round, nearly every couple’s score goes up.

fig5

Figure 5.  This figure shows the scores of all couples that made it to the finals and started competed in the quals.  We look at their score improvement vs the quals.  The Quals level shows score variability in qualifiers vs mean.

It is nearly impossible to believe that every couple does consistently a lot better in each round.  Rather, it is almost certain that the judges believe these couples to be better, given that they have made it this far.  This “round bias” probably doesn’t affect relative scores of couples, and thus standings.  However, what other unintentional biases do the judges harbor?

With this in mind, let’s take one final look at judging.  It turns out that it is possible to approximately figure out what the judges had in mind by grouping scores into certain “directions”.  This approach is called Principal Components Analysis and we will not go into the details.  We only need to keep in mind that the largest “components” of scores probably describe the most important things the judges looked at.  At the very least, they align dancers in terms of judges’ main points of consensus.  Figures 6-8 show the main directions of variability for the last two rounds (semis are displayed in full and only looking at the finalists).  The arrows represent individual judges’ opinions and rankings of dancers.  The arrows are labeled with the judges’ names.

fig6

Figure 6  Semifinals scores.  Most of the judges agree on scoring, and low, medium, and top scorers are reasonably well separated along the first “score component”.  This main component explains 39% of the total score variability.  Not great, but not bad.

fig7

Figure 7  Semifinals scores of couples advancing to the finals.  Judges agree a lot less – only 21.5% of scores are explained by consensus.  Two judges completely disagree about scoring with respect to the two main directions of score variability.  The fact that the scores of selected finalists are even less consistent than the scores of the overall group (figure 6) supports my idea that, in the semis, the judges are no longer able to discriminate the dancers on the merits too well.

fig8

Figure 8  The judges continue to only weakly agree on scoring – the main component explains only 35.5% of variability, and the judges’ opinions can be at times almost diametrically opposed with respect to the main directions of scoring.

The take-away from these figures is that, even focusing on the main directions of variability – likely aligning with technique and scoring, or something like that – the judges’ consensus is very weak, and is the weakest in the finals.

To make the above paragraph a lot less abstract, let’s observe that Aurora Lubiz and Gabriel Misse seem to disagree significantly about the finalists’ performances.  Let’s plot their scores, one vs the other, in Figure 9.

fig9

Figure 9  Disagreement among judges does, indeed, exist.  Gabriel Misse tended to disagree with Aurora Lubiz, to pick one example.  Also notice that Gabriel’s scores are much tighter – effectively, he thinks that all finalists are very, very close together, something our model also believes.  Aurora’s scores are very far apart, with clear winners and losers.

Is it possible that scoring dance is impossible beyond a certain point?  Let’s look at our cousins, the ballroom dancers, competing in the tango event at Blackpool, the world’s best-known ballroom competition.

fig10

Figure 10  Consistency of scoring at Blackpool.  # of votes to advance to the semis and from there to the finals (for the same dancers) is very related.  Despite the much smaller number of participants, the certainty in this relationship  is similar to that of scoring between semis and quals in the Campeonato (for the same strength of relationship, more points means more certainty).  This means the scoring at Blackpool is more consistent.

fig11

Figure 11.  Even among the finalists, Blackpool scores are more consistent than campeonato scores given the smaller number of participants.

Figures 10 and 11 show pretty good score consistencies between late and early rounds – similar to consistency of scoring between semis and quals, which we called not great, showing many dancers essentially tied.  However, one can readily notice that the lines don’t fit the data very well – the actual points have a “boomerang” shape – and there’s a good reason for this.  Blackpool seems to be scored very differently: the judges vote for “callbacks” rather than scores – at least that’s the data that I was able to obtain.  Therefore the right metric to judge the quality of scoring should also be binary, by a certain cut-off.  Without going into the details, the scoring is much more consistent than it looks, and seems more similar to the discriminating ability of the Campeonato scoring in Quals alone.  Why is that?  More likely than not, this has to do with the syllabus-based scoring system of the ballroom competitions, leading to far greater standardization of the accepted techniques and styles.

To forgive is divine

Does all of the above mean that the system is broken and that it’s impossible to score tango?  Not at all.  It is clearly possible to separate the pros from the amateurs – this happens in the quals, by and large.  The system can, in fact, be improved, and perhaps judges could be given a training round of judging some videos in order to arrive at a common scoring scheme that could be reused in later years.  Moreover, perhaps scoring in later rounds should be over twice as many dances, improving the judges’ ability to find consensus.

Should tango be scored on a syllabus system to improve consistency?  Probably not.  Tango’s vibrancy and strength have to do with its improvisational roots.  Diversity is its oxygen, and we shouldn’t abandon that for the sake of scoring.  For now, let’s all recognize that the judges are human, have tried hard, and have done their best.

As a corollary, let’s remember that even professional dancers serving as judges are subject to huge biases, inflating the dancers’ scores with each round.  As dancers, let’s keep that in mind when deciding who to dance with based on appearance, age, looks, or other potentially superficial factors and realize that that best dancer in the room is probably not very well removed from the second- or third-best dancer, if scoring were done.  Let this little data analysis serve as a mirror to each one of us.  It will do so for me.

I hope you have found this article useful and interesting.  See you on the dance floor.

Boris


Soy Un Arlequin: The anatomy of a dance


Introduction

Hello, fellow tangueros!

For a while now I have been focusing on the musicality in my dancing. I would like to offer to your attention an especially detailed exercise that I took myself through – a worked example, an annotation of a single song danced by Noelia and Carlitos. You can see the annotated song below. Just zoom out using the slider in the lower-left corner: the default zoom level is too close-in. Notice that you can play the song in half-time, which really helps when watching the interplay between the footwork and the music.

Using the SoundSlice viewer

https://www.soundslice.com/tabs/16365/carlitos-espinoza-y-noelia-hurtado-soy-un-arlequin-francisco-lomuto-tab/

Song structure

To help out with this section, please refer to http://www.tangomusicology.com (an independent resource), and in particular to the phrasing page:

http://www.tangomusicology.com/wordpres/structurequestion-and-answer-phrasing-an-overview/

This particular song consists of two basic sections, repeated, an 18-bar section (A) and a 20-bar section (B). The latter carries all the voice – this is a song for dancing with the singer, the great Charlo, singing only the refrain (see the following about the difference between the refrain and the orchestra singer:
http://www.tangology101.com/main.cfm/title/The-Role-of-the-Tango-Orchestra-Singer/id/946). At this level of annotation, the song looks like this:

ABA(voice)BA

Now let’s look at the sections.

Section A

Section A consists of three 6-bar phrases, the first two of which are repeats, and the third might be considered a very stylized repeat, so let’s call them phrases 1 and 2(or 1*). The overall structure of section A is:

1, 1, 2(1*)

Section B

Section B consists of two 8-bar phrases and one short phrase, a 4-bar that mirrors the first half of the first phrase of the section.

Numbering the phrases 3 and 4, the structure of this section is:

3, 4, 3*(first half, resolved)

The 6-bar phrases of section A and the 8-bar phrases of section B both neatly break down into question and response, except when they don’t: in section B, the last phrase is the question of phrase 3 but resolved so that there’s no need (and indeed no presence of) response.

For syncopation and beat annotation, I’ll refer you to the annotated video, and for more on music theory, as I have already mentioned, to http://www.tangomusicology.com/

Applying the annotation

Now that we have an annotated song (I take all the blame for any inaccuracies), what can we do with it? I’ll give several examples, mostly focusing on Carlitos’ use of linear vs circular movement. I’ll consider ambiguous movement to be decided by what the follower feels, rather than what the eye sees; that is, when Noelia is doing forward milonguero ochos, without any turning, in a circle around Carlitos, we’ll call it linear (but note the interesting goings-on). Before getting into the details, note that both the lead and the follower roles here are executed with a lot of complexity and with multiple layers. I’ll stay away from the follower part altogether, because it’s ‘above my paygrade’, but I will say that there’s a whole lot going on with presence/absence of embellishments that can be gleaned even from my relatively superfluous analysis. I have not annotated Noelia’s footwork, except where her movement is twice slower or faster than Carlitos’, or where she does traspie, but both of those are led elements and should not be considered adornos.

Linear vs Circular movement

So, let’s talk about linear vs circular movement. Depending on

‘what the music does’, one can lead circles (giros, molinettes, etc) or lines (walks, ochos cortado, etc). One can lead either, but what to lead when? Ok, all leaders are taught pretty early that it’s probably nice to lead circles in vals. Watch an old (or new) video with Viennese Waltz and you’ll see why. Some older tango valses, especially Canaro’s, do sound very Viennese, and may have been meant that way from Canaro’s time in Europe. However, is there any reason to lead lines vs circles in tango?

The tango in question, Lomuto’s version of ‘Soy Un Arlequin’, is an old piece, written by Discepolo in 1929, pre-golden age, probably to go with strong guitar sound (diminished or absent here, I can’t quite tell). This version was probably arranged in that time frame as well, but its arrangement was more modern than most tangos of its time, and probably more modern than the song was intended for by Discepolo. The song has a great mixture of rhythmic and melodic phrases and of staccato through legato articulation.

I have created several tracks that help to understand both the music and the movement. The tracks relevant to the question of circular vs linear movement are:

Direction of travel (circular, linear)

Articulation (legato, non-legato, staccato)

Beat (even, syncopated)

Question/response phrase annotation

Do the last 3 elements (articulation, Beat, QR) have anything to do with Carlitos’ choice of direction of travel? Is that one of the tools that he uses to ‘annotate’ the music?

Let’s do some tabulation of how often different music elements occur with linear vs circular leads (hopefully I haven’t made any counting errors):

image004

Conclusion: staccato articulation is always linear; legato is predominantly circular; non-legato is predominantly linear, at least in this very rhythmic song.

Other examples

image006

Conclusion: Even beat is usually linear (just walk). Syncopated can vary.

image008

Conclusion: It is obvious that Carlitos tries to lead a question and response phrase in the same style of walking (although frequently there’s a difference in syncopation articulated by a traspie)

Let’s finish by noting that linear vs circular decision depends on these three elements JOINTLY. That type of analysis is beyond the scope of my examples.

Homework

As homework, consider: what drives Carlitos’ decision to lead a traspie? to lead 1/2x, 1x, or 2x the tempo of the driving beat? Hopefully my annotation of this song makes it easier to ask these questions.