
Introduction
Tango is a social dance with a long history of professional “cottage industries” around it, from musical performance and DJing to dance teaching and taxi dancing. Like other social dances, tango has had a history of competitions during its Golden Age. For instance, Petroleo, the famed tanguero and taxi dancer, started his career competing in tango tournaments. Today, as back then, some roads to professional tango start in competitions. It is fair to say that the concept of tango championship is organic to the tango universe.
Today, the pinnacle of tango competition is the Tango World Championship (Campeonato Mundial de Baile de Tango), which goes back to 2003 and has helped launch careers of many established professionals. The resulting “official label” has probably helped legitimize many of the traveling pros and therefore popularize modern Argentine tango outside of Argentina. The championship is not limited to the pros – anyone can enter the qualification round and, hopefully, advance. Unlike ballroom competitions, there’s no defined syllabus, so there’s no need to drill to a jury’s expectations. By learning to be musical, move well, and connect to your partner – by being a great social dancer – one can hope to succeed in the salon category of The Mundial. At the same time, not having a syllabus to judge against, and not having launched their careers around syllabi, members of a jury may be judging from different vantage points and coming to subjective conclusions about the dancing couples. Is it possible to tell whether the judging is objective? How well do the judges compensate for their biases? And how big is the difference between winners and runners up? In other words, how much does tango competition tell us about tango? In this essay, we arm ourselves with fairly simple statistical tools and take a look at the 2016 competition data for tango de salon (available online – e.g., the finals).
Jumping ahead, I will say that we find surprisingly complete answers to all of the above questions. Some teasers:
- It is possible to tell apart bad dancers from good dancers, and great dancers from good dancers
- The better the dancers, the less possible it is to rank them with the current scoring system, until, in the finals, rankings don’t really make sense
- Judges bring many biases to the table. For instance, “confirmation bias” – they rank supposedly better dancers higher even if there is no difference
- Judges often disagree – boy, do they ever!
I hope this exercise in data journalism proves educational and interesting, and I have gone to great lengths to ensure that it’s simple for the un-initiated and rigorous for the rest. All of the code will be available with this write-up when all parts are posted.
Read on for more!
Campeonato Mundial: the participants
To warm up, let’s start with the countries in the Campeonato Mundial. Excluding the direct qualifiers to the semifinals and finals, the participants hailed from 27 countries. In many cases, these countries had very few representatives, but some parts of the world fielded very strong and often large teams. This strong participation allows us to ask ourselves our first question: do some countries have especially strong tango cultures? For example, there’s anecdotal evidence that professional tango is very strong in Colombia and Russia. This brings us to Figure 1 – rank distribution by country. Russia and Colombia do indeed look to have very strong representations – with median ranks of ~60 and ~80 in a crowded field of over 400 contestants. Moreover, these results are statistically significant – they are highly unlikely to arise by random chance (here and elsewhere, the savvy readers are encouraged to step through the attached code – we will skip such details in most cases). It would seem that, indeed, there are countries with exceptionally strong professional cultures.

Figure 1 Results by country in the qualifiers and semifinals. Note strong qualifying round performance from Russia and Columbia.
What’s going on with Argentina? Figure 1 suggests that Argentina is decidedly average! But everyone knows that the Argentines usually do very well at the championships, usually winning. What gives? It turns out that Argentina, being the host, has by far the largest delegation – 289 contestants in the qualifiers out of the total of 404. It is basically the baseline. Relatively distant and at the same time relatively mid-income countries like Columbia and Russia are unlikely to send many merely decent dancers, and the people who fly to Buenos Aires to show off their chops tend to be pros. This, I suspect, is the reason for these countries’ delegations unusually strong performances.
To get to the semi-finals, couples are pruned by high scores in the quals, placed directly from nationals elsewhere, or place highly in Campeonato de baile de ciudad. Given the much stronger field, all of the stand-out effect of Russia is gone, and Columbia is barely noteworthy – leading the field with a marginally unusual placement rate. The sheer number of the great Argentine dancers tell – Argentina leads the semi-finals field with 71 dancers of the 108 competitors.
Campeonato Mundial: to err is human
Part I: The Dancers
To introduce the topic of human fallibility, look at Figure 2.

Figure 2 Day 2 scores vs Day 1 scores. Couples that qualified for semifinals are shown as red points. The black line shows ideal equality (all couples score the same on both days), while the blue line shows the actual relationship between scores on two days. The day 2 scores are 67% explained by the day 1 scores. The red bar points out inter-day, intra-qualifier uncertainty in score for semifinal qualifiers (95% confidence interval). Essentially, everyone who might have been the best in the quals qualified for the semifinals (a good outcome). Another way to say it is, in the eyes of the judges, all couples that advanced to the semis are essentially tied (a bad outcome).
Each point on the figure corresponds to a couple. On the x axis are the day 1 scores, while on the y axis are the day 2 scores. Red points are the couples that qualified for the semifinals from the quals. The black line shows the ideal situation – that human judges give couples exactly the same scores each time they see them dance three songs. The blue line illustrates the actual correspondence between the scores. The red bar shows the uncertainty in the score on day 2 based on this model given a couple’s score on day 1. In other words, in 95% of the cases, a jury would give the score in that range. The score is shown for a “median” qualifying couple – half of the qualifying couples did better and half worse. This score roughly spans more or less the range of all qualifying couples. What does this mean? The complimentary way of saying this is: the process worked, and the couples that made it into the semis from the quals would have made the cut in most cases. The less complimentary way of saying this is: the couples qualifying for the semis were essentially jointly tied for the first place in the quals. If this pattern held, we would expect these couples to continue to be tied. In other words, looking at their ranks in the qualifiers would give us very little information about their ranks in the semifinals. If they are all tied, then each time they compete their scores would fluctuate slightly due to couples’ day-to-day variability and judges’ slight differences in perception, as well as due to a jury’s composition. There would be no stability to the ranks. This is something we can easily check. Do couples perform in the semifinals according to their ranks in the quals?
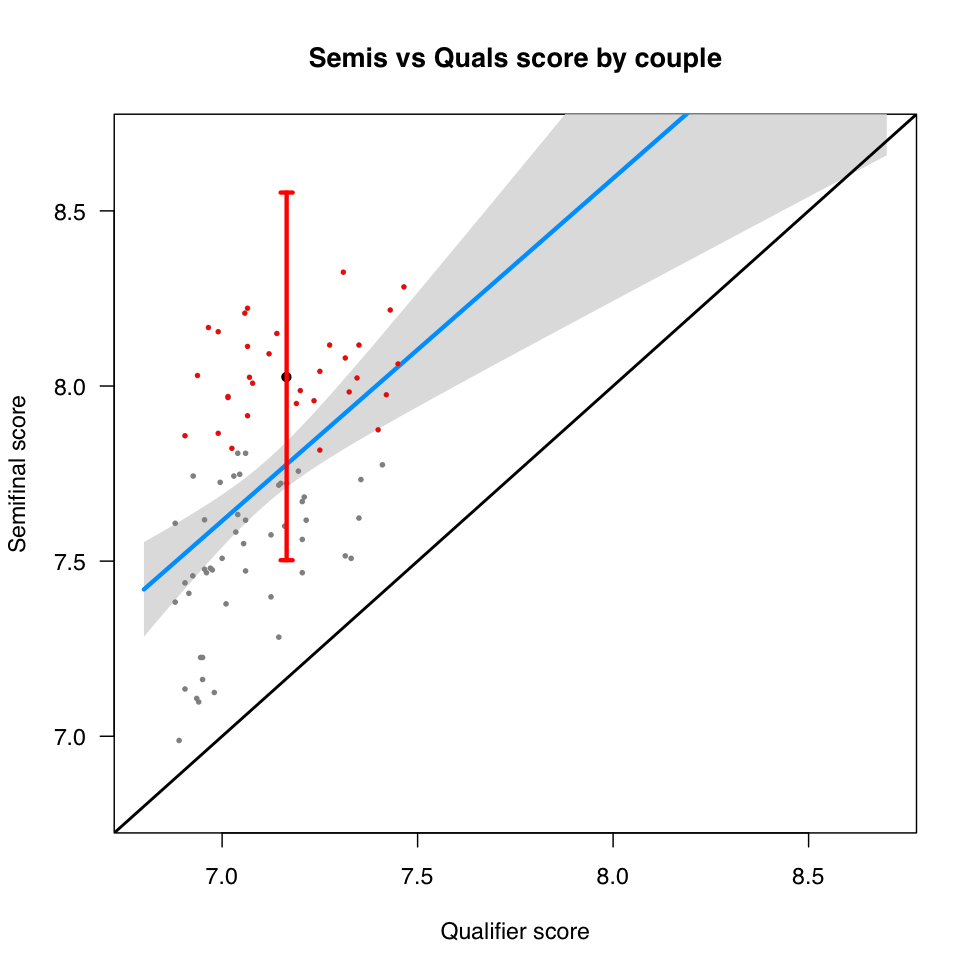
Figure 3 Semifinal scores of the couples that qualified to the semis from the quals. The couples that qualified for the finals are shown in red, and the red bar illustrates the uncertainty in the score of median finals qualifiers based on score stability.
Figure 3 unambiguously tells us: sort of. In fact, qualifiers scores for couples who made it to the semifinals explain only 24% of their scores in the semis. In other words, whereas qualifiers contestants were mostly well separated from the couples who made it to the next round, the semifinalists were mostly tied in the sense of being within the red bars of score uncertainty (95%). The error bar is placed over the median couple that qualified from the semis to the finals. Roughly two thirds of all couples can be thought of tied with the winners. Notice that we are excluding a number of couples from this plot – everyone who qualified directly into the semis from a national competition or the Ciudad. Here’s the meager good news from this round: a new jury looking at the same couples ordered them in an order somewhat resembling their standings from the quals. The bad news is: the order is mostly different. Worse, this plot looks weird, especially if you compare it to Figure 2: all of the scores in the semis are higher than they were in the quals – all points are above the black line. All couples that made it into the semis from the quals scored better. We will look into this separately, so for now make a mental note that there’s something going on here.
To round off our investigation of score consistency, let’s look at Figure 4, showing the couples that qualified from the semis into the finals.

Figure 4. Finals vs semifinals scores for the couples that qualified for the finals. Notice that, once again, finals scores are higher for every couple.
Now there’s very little consistency to the scores. Statistically, the relationship among couples’ scores in each round is “suggestive”: maybe it’s there, maybe it’s not. It’s not unreasonable to believe, based on this plot, that there may be no relationship. Most likely, there is, and there are just too few dancers to tell. Once again, the figure looks weird – all couples seem to be doing better – but we’ll come back to this. Instead, let’s tally up what we see in figures 2-4.
- In the qualification round, where couples competed over two days, score uncertainty per couple was about 1.5 points. In later rounds, that was also roughly the relationship between scores of round winners in a round and their scores in the next round
- Winners of the qualifiers fell almost exactly 1.5 points from the highest-scoring couple
- With each round, the scores of couples advancing to the next round bear less and less similarity to the same couples’ scores in that next round
- With every round, the relationship between the scores of advancing dancers in both rounds seems to look weirder and weirder.
The explanation that makes the most sense, that neatly wraps up the first three observations is this: given the scoring rules and the competition format, the judges are unable to determine scores more accurately than to within +/- 0.7 points. Is it possible that the dancers’ performance fluctuates by that much? Probably not. The main reason to believe that it’s not the dancers is simply this: every round is supposed to select better, more consistent couples (and the first round certainly does!). Why don’t these couples’ score variabilities between rounds shrink? If dancers’ consistency drove the score variability, with every round the uncertainty in scores of advancing dancers would decrease rather than stay the same or grow.
Part II: The Judges
We have established the judges made seemingly random (though relatively small) errors in judgement – errors that increasingly seemed to affect final standings in every successive round, from “not much” in the quals to “almost entirely” in the finals. Unfortunately, these random mistakes are not the only errors in judging. Probably of greatest concern is lack of objectivity in scoring. I am definitely not suggesting that judges favor by looks, age, or any other parameter – I don’t have any evidence for this. I am, however, unequivocally stating that the judges bring their perceptions to the table – strongly so. Consider the observation number 4 above. In every plot, 2-4, the scores of every couple in a successive round are higher than they were in the preceding one. This is illustrated most clearly in Figure 5: in every round, nearly every couple’s score goes up.

Figure 5. This figure shows the scores of all couples that made it to the finals and started competed in the quals. We look at their score improvement vs the quals. The Quals level shows score variability in qualifiers vs mean.
It is nearly impossible to believe that every couple does consistently a lot better in each round. Rather, it is almost certain that the judges believe these couples to be better, given that they have made it this far. This “round bias” probably doesn’t affect relative scores of couples, and thus standings. However, what other unintentional biases do the judges harbor?
With this in mind, let’s take one final look at judging. It turns out that it is possible to approximately figure out what the judges had in mind by grouping scores into certain “directions”. This approach is called Principal Components Analysis and we will not go into the details. We only need to keep in mind that the largest “components” of scores probably describe the most important things the judges looked at. At the very least, they align dancers in terms of judges’ main points of consensus. Figures 6-8 show the main directions of variability for the last two rounds (semis are displayed in full and only looking at the finalists). The arrows represent individual judges’ opinions and rankings of dancers. The arrows are labeled with the judges’ names.

Figure 6 Semifinals scores. Most of the judges agree on scoring, and low, medium, and top scorers are reasonably well separated along the first “score component”. This main component explains 39% of the total score variability. Not great, but not bad.

Figure 7 Semifinals scores of couples advancing to the finals. Judges agree a lot less – only 21.5% of scores are explained by consensus. Two judges completely disagree about scoring with respect to the two main directions of score variability. The fact that the scores of selected finalists are even less consistent than the scores of the overall group (figure 6) supports my idea that, in the semis, the judges are no longer able to discriminate the dancers on the merits too well.

Figure 8 The judges continue to only weakly agree on scoring – the main component explains only 35.5% of variability, and the judges’ opinions can be at times almost diametrically opposed with respect to the main directions of scoring.
The take-away from these figures is that, even focusing on the main directions of variability – likely aligning with technique and scoring, or something like that – the judges’ consensus is very weak, and is the weakest in the finals.
To make the above paragraph a lot less abstract, let’s observe that Aurora Lubiz and Gabriel Misse seem to disagree significantly about the finalists’ performances. Let’s plot their scores, one vs the other, in Figure 9.

Figure 9 Disagreement among judges does, indeed, exist. Gabriel Misse tended to disagree with Aurora Lubiz, to pick one example. Also notice that Gabriel’s scores are much tighter – effectively, he thinks that all finalists are very, very close together, something our model also believes. Aurora’s scores are very far apart, with clear winners and losers.
Is it possible that scoring dance is impossible beyond a certain point? Let’s look at our cousins, the ballroom dancers, competing in the tango event at Blackpool, the world’s best-known ballroom competition.

Figure 10 Consistency of scoring at Blackpool. # of votes to advance to the semis and from there to the finals (for the same dancers) is very related. Despite the much smaller number of participants, the certainty in this relationship is similar to that of scoring between semis and quals in the Campeonato (for the same strength of relationship, more points means more certainty). This means the scoring at Blackpool is more consistent.

Figure 11. Even among the finalists, Blackpool scores are more consistent than campeonato scores given the smaller number of participants.
Figures 10 and 11 show pretty good score consistencies between late and early rounds – similar to consistency of scoring between semis and quals, which we called not great, showing many dancers essentially tied. However, one can readily notice that the lines don’t fit the data very well – the actual points have a “boomerang” shape – and there’s a good reason for this. Blackpool seems to be scored very differently: the judges vote for “callbacks” rather than scores – at least that’s the data that I was able to obtain. Therefore the right metric to judge the quality of scoring should also be binary, by a certain cut-off. Without going into the details, the scoring is much more consistent than it looks, and seems more similar to the discriminating ability of the Campeonato scoring in Quals alone. Why is that? More likely than not, this has to do with the syllabus-based scoring system of the ballroom competitions, leading to far greater standardization of the accepted techniques and styles.
To forgive is divine
Does all of the above mean that the system is broken and that it’s impossible to score tango? Not at all. It is clearly possible to separate the pros from the amateurs – this happens in the quals, by and large. The system can, in fact, be improved, and perhaps judges could be given a training round of judging some videos in order to arrive at a common scoring scheme that could be reused in later years. Moreover, perhaps scoring in later rounds should be over twice as many dances, improving the judges’ ability to find consensus.
Should tango be scored on a syllabus system to improve consistency? Probably not. Tango’s vibrancy and strength have to do with its improvisational roots. Diversity is its oxygen, and we shouldn’t abandon that for the sake of scoring. For now, let’s all recognize that the judges are human, have tried hard, and have done their best.
As a corollary, let’s remember that even professional dancers serving as judges are subject to huge biases, inflating the dancers’ scores with each round. As dancers, let’s keep that in mind when deciding who to dance with based on appearance, age, looks, or other potentially superficial factors and realize that that best dancer in the room is probably not very well removed from the second- or third-best dancer, if scoring were done. Let this little data analysis serve as a mirror to each one of us. It will do so for me.
I hope you have found this article useful and interesting. See you on the dance floor.
Boris
Hi Boris,
thank you for the interesting analysis. I attended the event and did some preliminary analysis similar to yours.
just for your information, the judges do not rank on a ten point scale in each round. They are told to give scores of up to 8 during the quals, up to 9 during the semi, and up to 10 during the final (roughly).
What I find most interesting is how the winners were the favorite couple of only 2 judges (iirc) and the two couples who judged likely to win by crowd consensus during the event, placed second and third (no-one predicted the winner).
This is in stark contrast to escenario where it was much clearer during the quals and semi finals who would end up on the podium.
Kind regards,
Philip Kerpen
Ah, where were you two months ago?! I wasn’t able to obtain this information, not for the lack of trying. Will contact you on Facebook and try to ask a few questions.
Boris, when you said “perhaps judges could be given a training round of judging some videos in order to arrive at a common scoring scheme that could be reused in later years”, I though “bingo, AI is the way to go 🤗…”
I don’t know if I would go that far. You and I could be replaced by robotic partners for greater consistency, too!